Silver Range Cuts 33.3 g/t Silver Over 50.86 m at Snap Zone and Confirms Additional High-Grade Silver Mineralization Near Faro, Yukon
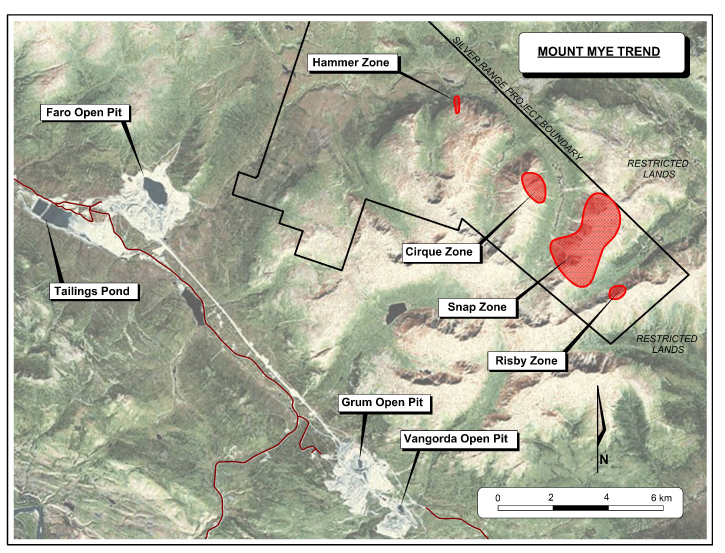
December 15, 2011 – Silver Range Resources Ltd. (TSX-V: SNG) (“Silver Range” or “the Company”) is pleased to announce results from initial drilling at the Snap Zone, part of its wholly-owned Silver Range Project. The Snap Zone lies 29 km south-southeast of the Keg Zone, the Company’s bulk-tonnage silver discovery, and 6 km southeast of the Hammer Zone, a new bonanza-grade silver discovery announced by Silver Range on December 1, 2011.
The Silver Range Project is located in an area of excellent infrastructure near the town of Faro in southern Yukon.
Highlights from 2011 work at the Snap Zone and vicinity include:
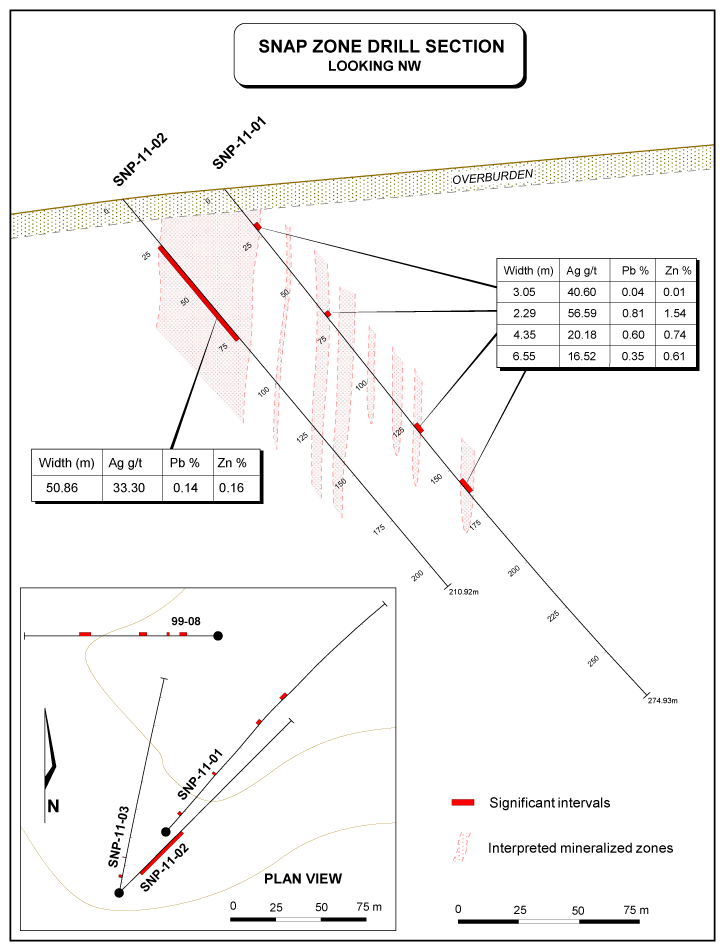
- A near-surface drill intercept that averaged 33.3 g/t silver over 50.86 metres;
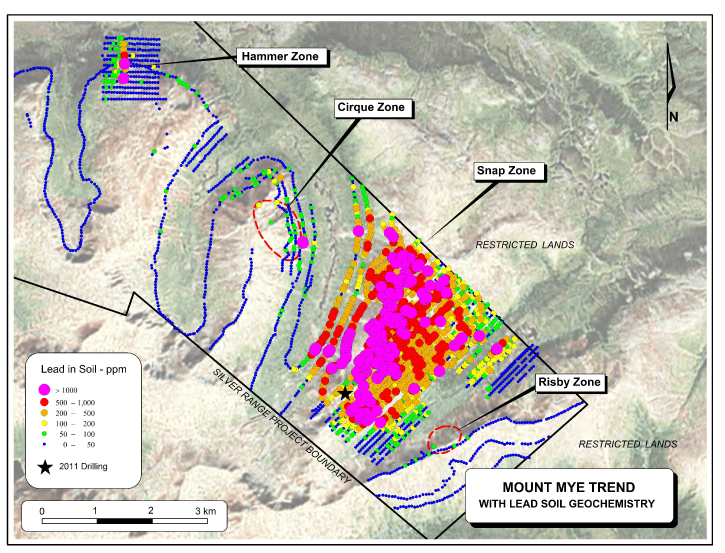
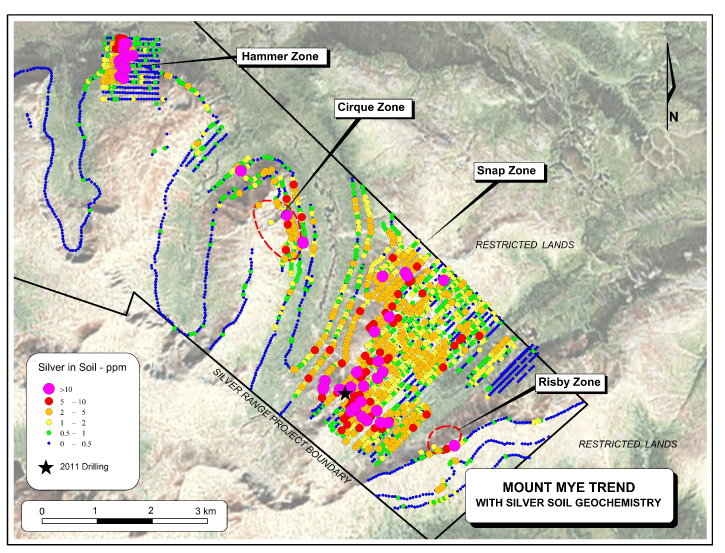
- Soil geochemical surveys that outlined strongly to very strongly anomalous silver (up to 75.8 g/t), lead (up to 7,360 ppm) and tin (up to 302 ppm) values over an area measuring 3,700 m by 2,250 m; and
- Rock sampling that confirmed high-grade silver (up to 2,460 g/t) and gold (up to 8.82 g/t) mineralization at the nearby Cirque and Risby Zones.
Three reconnaissance diamond drill holes were completed across part of the Snap Zone in 2011. The first two holes were drilled on a section line from pads located 42 m apart. The third hole was drilled from the same site as the second hole, rotated about 34° off section to the north. All three holes cut sheeted fractures and veins that are surrounded by pervasively clay altered granite. The veins show both epithermal and mesothermal features suggesting that overlapping mineralizing events may have occurred. The following table lists significant intervals from the holes.
| Hole # | From | To | Interval | Ag | Pb | Zn | Sn | Au |
|---|---|---|---|---|---|---|---|---|
| (m) | (m) | (m)* | (g/t) | (%) | (%) | (ppm) | (g/t) | |
| SNP-11-01 | 18.89 | 21.94 | 3.05 | 40.60 | 0.04 | 0.01 | 17 | 0.01 |
| 66.14 | 68.43 | 2.29 | 56.59 | 0.81 | 1.54 | 413 | 0.05 | |
| 126.00 | 130.35 | 4.35 | 20.18 | 0.60 | 0.74 | 123 | 0.01 | |
| 156.05 | 162.60 | 6.55 | 16.52 | 0.35 | 0.61 | 122 | 0.36 | |
| SNP-11-02 | 24.99 | 75.85 | 50.86 | 33.30 | 0.14 | 0.16 | 50 | 0.03 |
| including | 65.40 | 67.67 | 2.27 | 480.42 | 0.32 | 0.28 | 177 | 0.14 |
| or | 65.40 | 75.85 | 10.45 | 122.61 | 0.20 | 0.32 | 88 | 0.05 |
| SNP-11-03 | 12.80 | 13.70 | 0.90 | 30.00 | 0.02 | 0.19 | 107 | 0.18 |
| 31.65 | 32.15 | 0.50 | 31.70 | 0.17 | 0.27 | 201 | 0.03 |
*True thickness estimated to be approximately 70% of intersected lengths.
Soil geochemistry has defined exceptional results at the Snap Zone, with strongly to very strongly anomalous silver (2 to 75.8 g/t), lead (200-7,360 ppm) and tin (20-302 ppm) values over an area measuring 3,700 m by 2,250 m. Most of the anomalous values have not been investigated, but preliminary field observations indicate that sheeted veins and clay alteration are extensive in the area. Limited historical drilling (9 short holes) in the southernmost portion of the Snap Zone returned promising results, including 26.8 g/t silver and 1.5 g/t gold over 7 m and 87.7 g/t silver and 0.04 g/t gold over 8.9 m.
The Snap and Hammer Zones are two of several silver-bearing showings and geochemical anomalies identified within a 14 km long trend known as the “Mount Mye Belt.” Additional zones within this trend include the Cirque and Risby Zones. A well-mineralized rock sample collected in 2011 from the Risby Zone, located 700 m to the southeast of the Snap Zone, assayed 767.0 g/t silver and 8.82 g/t gold. Eighteen historical rock samples from this area averaged 426.9 g/t silver and 3.31 g/t gold. Historical trench samples returned 786.0 g/t silver and 6.5 g/t gold over 1 m as well as and 384.7 g/t silver and 2.12 g/t gold across 4 m. Twenty mineralized rock samples collected in 2011 from the Cirque Zone, located 3 km to the west of the Snap Zone, assayed from 9.04 to 2,460 g/t silver and 0.051 to 1.12 g/t gold, averaging 408.9 g/t silver and 0.22 g/t gold. The longest chip sample assayed 327.0 g/t silver, 0.089 g/t gold and 3.53% lead over 3.6 m. The high-grade mineralization at the Risby and Cirque Zones may be genetically related to the epithermal style mineralization recently discovered at the Hammer Zone.
The Mount Mye Belt lies 12 km northeast of the former Faro mine and mill site, which was once Canada’s largest open pit lead-zinc producer. Maps showing the locations of the various zones and geochemical anomalies can be viewed at www.silverrangeresources.com.
The Mount Mye Belt trends northwesterly and parallels the Tay Belt, which lies 15 km to the northeast. The Tay Belt contains the Keg, Owl, Drex and Marks and other zones. Both belts host silver-rich mineralization but they are somewhat different in character. In the Tay Belt, mineralization is usually found in sedimentary units and silver occurs with mesothermal base metal minerals. Zones within the Mount Mye Belt are mostly hosted by granitic rocks, are often epithermal and are locally gold enriched.
Analytical work was done by ALS Chemex with sample preparation in Whitehorse and assays and geochemical analysis in North Vancouver. Core samples were fine crushed before a 250 gram split was pulverized to better than 85% passing 75 microns. Soil samples were dried and screened to -180 microns. All core and soil samples were routinely analyzed for 51 elements by aqua regia digestion followed by inductively coupled plasma - atomic emission spectroscopy and mass spectrometry (ME-MS41). Over-limits were assayed for silver, lead and zinc by inductively coupled plasma - atomic emission spectroscopy (Ag/Pb/Zn-OG62) and where necessary by a gravimetric method (Ag-GRA21). All core samples were analyzed for tin by x-ray fluorescence spectroscopy (Sn-XRF05) and gold by fire assay followed by atomic absorption (Au-AA24). Soil samples were analyzed for gold by aqua regia digestion followed by inductively coupled mass spectrometry (Au-TL43).
Rigorous procedures are in place regarding sample collection, chain of custody and data entry. Certified assay standards, duplicate samples and blanks are routinely inserted into the drill core sample stream to ensure integrity of the assay process.
The 2011 exploration program at the Silver Range Project was conducted by Archer, Cathro & Associates (1981) Limited. Matthew R. Dumala, P. Eng. has reviewed the technical data presented in this news release and is a qualified person as defined in National Instrument 43-101.
ON BEHALF OF THE BOARD
“W. Douglas Eaton”
President and Chief Executive Officer
For further information concerning Silver Range or its exploration projects please contact:
Corporate Information
Silver Range Resources Ltd.
W. Douglas Eaton
President and C.E.O.
Tel: (604) 688-2568
Silver Range Resources Ltd.
Bruce A. Youngman
Chairman
Tel: (604) 687-2522
Investor Inquiries
Richard Drechsler
Corporate Communications
Tel: (604) 687-2522
NA Toll-Free: (888) 688-2522
rdrechsler@silverrangeresources.com
www.silverrangeresources.com
Neither the TSX Venture Exchange nor its Regulation Services Provider (as that term is defined in the policies of the TSX Venture Exchange) accepts responsibility for the adequacy or accuracy of this release.
Mt. Mye Trend
Mt. Mye Trend Lead
Mt. Mye Trend Silver
Snap Zone Drill Section